
Back to Overview
What It Takes to Operate and Maintain Principal Pipelines
Table of Contents
Document
- Author(s)
- Julia H. Kaufman, Susan M. Gates, Melody Harvey, Yan Wang, and Mark Barrett
- Publisher(s)
- RAND Corporation
Page Count
96 pages
- DOI Link
- https://doi.org/10.7249/RR2078
Research Approach
Researchers created a list of activities associated with each of the four principal pipeline components. They also listed activities that could constitute a system of support for the pipeline. They then gathered data on the resources and expenditures associated with those activities in the six school districts that received funding from The Wallace Foundation through the Principal Pipeline Initiative. Their data-gathering and analyses took into account both personnel costs and other expenditures that school districts assumed to develop and manage pipelines, including costs for materials, hardware, software, consultants, and other items or services associated with principal pipeline activities. The cost estimates presented in the report are intended to inform school districts around the country about what it could take to build and operate a strong principal pipeline.
Recognizing that other districts might not have the capacity to undertake investment in the entire pipeline at one time, researchers strived to provide estimates of overall principal pipeline costs in the participating districts and estimates for the costs of individual categories and activities associated with principal pipelines.
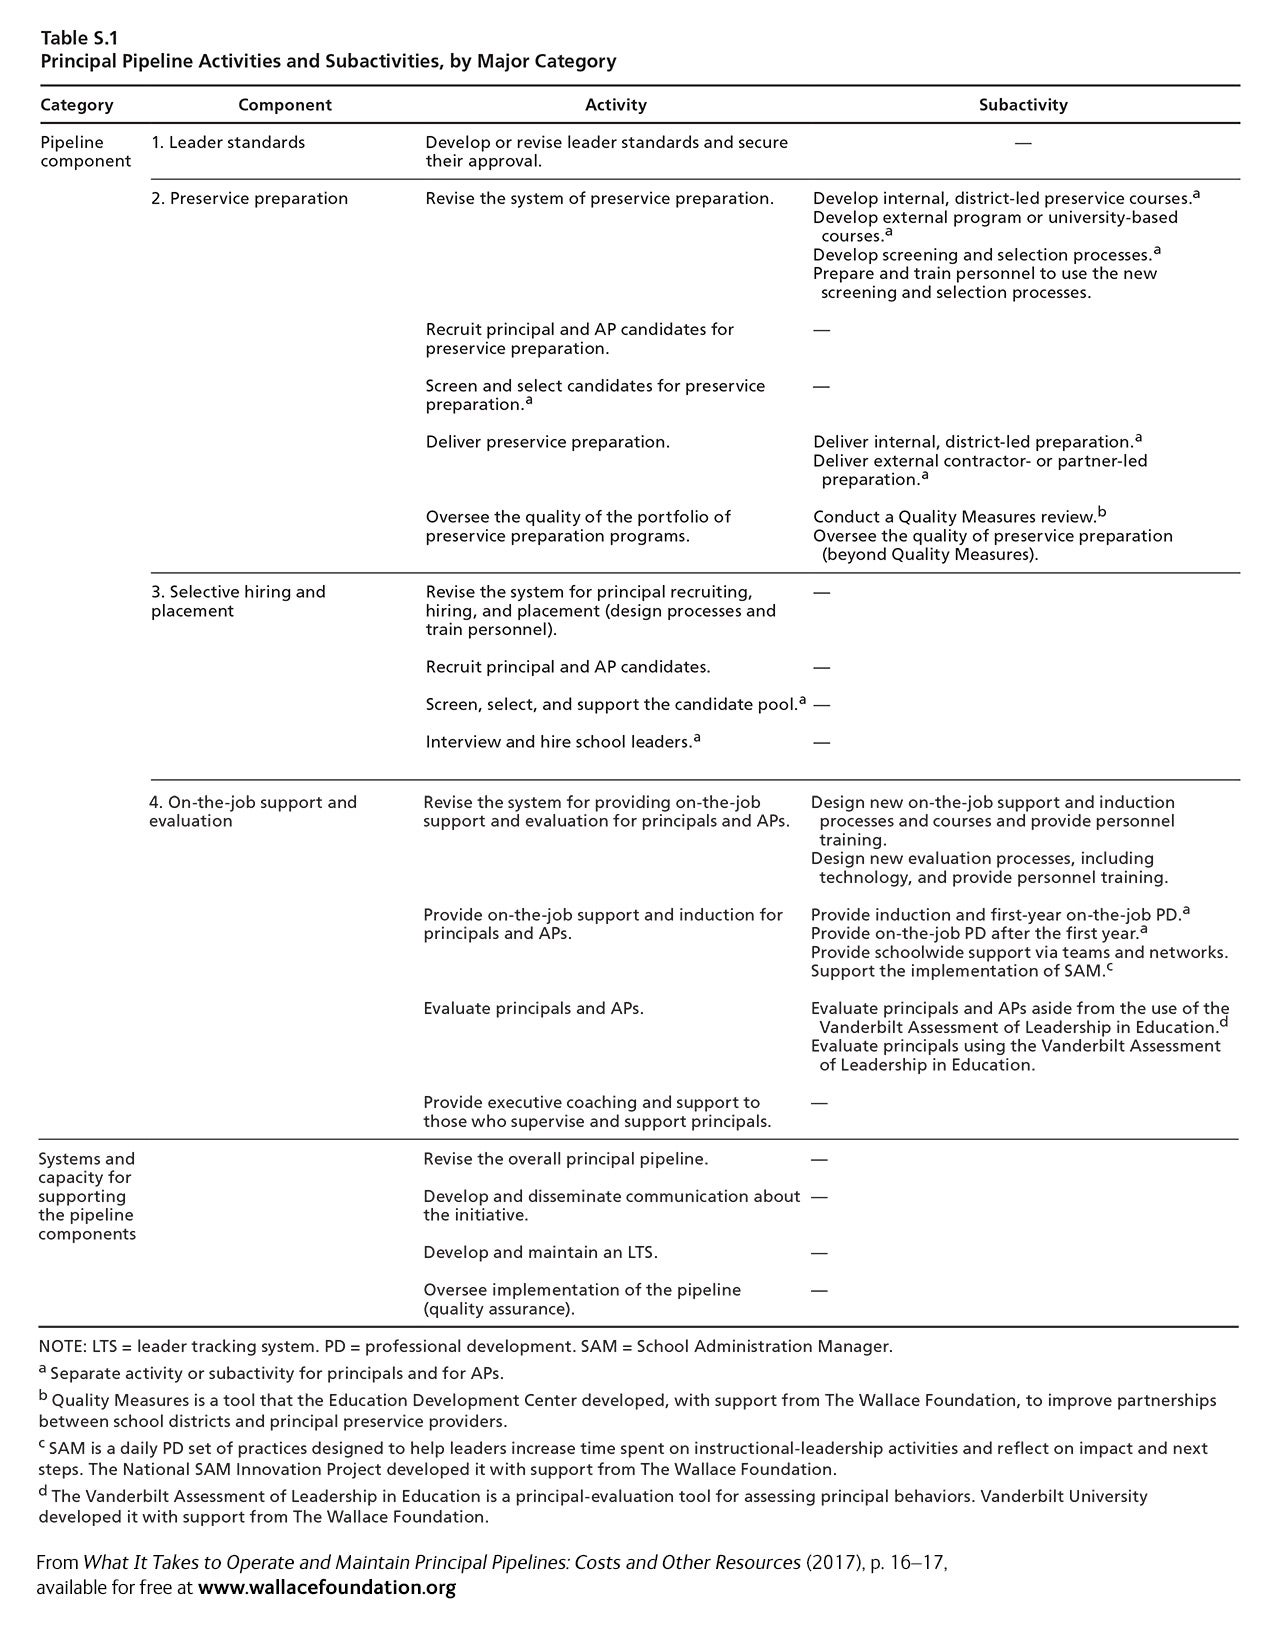
In their data-gathering and analysis, they used an activity-based approach (Kaplan and Cooper, 1998; Miles et al., 2004; Chambers, Lam, and Mahitivanichcha, 2008). Guided by this approach, they developed a list of activities that could be associated with principal pipelines. They categorized each activity under one of the four components of a principal pipeline, as described above. They also gathered information on systems of support for a comprehensive principal pipeline, which made up a fifth category of activities. They divided some activities within major categories into subactivities. The resulting list of activities and subactivities is provided in Table S.1 of the report.
Principal pipeline costs are not a line item in school budget and expenditure reports. For this study, researchers gathered information about the costs of activities through multiple data sources. The data sources for our study included the following:
- District principal pipeline expenditure reports. Each participating district provided these to The Wallace Foundation on principal pipeline–related spending over the course of the initiative—from August 2011 through December 2015.
- Expenditure reports for technical assistance. The Wallace Foundation also collected expenditure reports from consultants and organizations with which they contracted to provide guidance to districts for aspects of the Principal Pipeline Initiative, which researchers used to identify technical assistance work that was key to districts’ pipeline work.
- In-depth interviews with district personnel. Researchers collected these to resolve questions about information provided in district expenditure reports and identify gaps in the information about expenditures provided in those reports.
- District personnel resource-allocation data. Researchers collected these to account for the value of the time that district personnel spent on principal pipeline activities.
- Survey data. Policy Studies Associates administered surveys in 2014 and 2015 as part of its implementation evaluation efforts (Turnbull, Anderson, et al., 2016).
- District proposals, budgets, and progress reports. Each participating district provided these to The Wallace Foundation.
Researchers provide estimates of how much the participating districts spend on pipeline activities in a baseline pre-initiative year and in five years that span the initiative. Their estimates of pre-initiative spending on these same activities, although rough, provide information on business as usual in these districts. The study focused on the resources and expenditures associated with district efforts to support school leadership, not the totality of resources devoted to school leadership itself. The study also focused on the resources expended by districts, not other stakeholders. As a result, it excluded from consideration the salary costs of the school leaders themselves. Researchers recognize that school leaders might participate in the preparation or management of other school leaders, which might be expected to vary because of differences in conditions related to the market for school leaders. In cases in which a school leader was paid a stipend beyond salary in order to take on additional responsibilities to support the principal pipeline, they include those costs.
Table S.2 on p. XV of the report provides an overview of all the decisions researchers made about what to include in and exclude from cost estimates. Chapter Two of this report provides more detail on the associated challenges and limitations that each decision presented. After using the activity list to categorize resources and expenditures—and making final decisions about what costs to include—researchers generated district-by-district summaries of pipeline costs. They transformed these summary data to account for regional variation in purchasing power (i.e., cost of living) and inflation during the time period.
After adjusting for cost of living, they also adjusted costs in each district depending on various drivers, and they present costs by various cost drivers throughout this report, focusing particularly on costs per principal.
Topics:


