
Collect reliable data, mine it for insights and act wisely on the information: That’s a recipe for continuous improvement for any organization. Out-of-school-time intermediaries, the organizations that oversee communitywide systems of afterschool, summer and other out-of-school-time (OST) programs, recognize the value of effective data analysis. But deciding what data to collect, how to collect it and, most importantly, how to use it to drive improvement can be overwhelming.
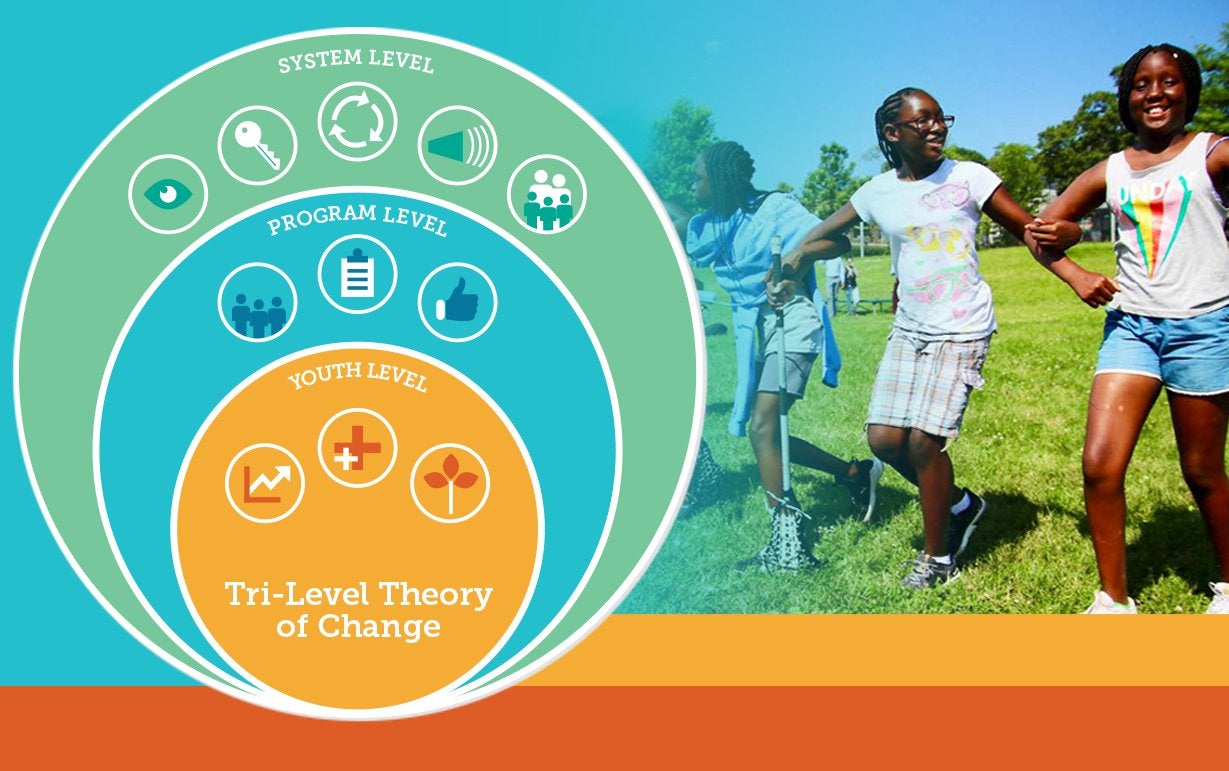
A new tool—Putting Data to Work for Young People: A Framework for Measurement, Continuous Improvement, and Equitable Systems—aims to help. The tool updates an earlier version from 2014 and was developed by Every Hour Counts, a national coalition of citywide OST organizations that seeks to increase access to high-quality learning opportunities, particularly for underserved students. The framework itself consists of 11 desired outcomes for an OST system at the systemic, programatic and youth level. Each outcome features a set of indicators to measure progress toward it and the types of data to collect along the way. The data-collection efforts of three OST intermediaries—Boston After School & Beyond, Providence After School Alliance, and Sprockets in St. Paul —informed the updated tool, as well as an accompanying guide written by RAND Corp. researchers Jennifer Sloan McCombs and Anamarie A. Whitaker, who led an evaluation of how the intermediaries used the framework.
Recently The Wallace Blog spoke with McCombs and Jessica Donner, executive director of Every Hour Counts, about the framework and the experiences of the intermediaries. This interview has been edited for length and clarity.
How did you determine the updated framework’s 11 outcomes and the related data indicators?
Donner: The selection of outcomes was driven by the on-the-ground experiences of the three intermediaries, the Every Hour Counts network, the knowledge brought to bear on the project by research partners and the existing literature on effective practice. The data indicators were developed by RAND based on their research expertise, the experience of the three intermediaries and RAND’s criteria to minimize burden on providers, intermediaries, staff and students, and efficiency for data collection and utility. This framework builds on prior iterations, specifically one developed with American Institutes for Research in 2014.
What did you learn from the three intermediaries as they used the 2014 framework?
Donner: We worked with these intermediaries because they had the bandwidth and expertise to hit the ground running with the framework. What we learned is that even highly accomplished intermediaries face tremendous challenges with data collection and use—staff capacity, research expertise, how to narrow down a host of outcomes and indicators to measure those outcomes. Where did they start? We had this framework, but the process was very overwhelming.
We undertook the framework update and intentionally designed a tool that would make the data collection and use process more digestible, such as tips for staging the work and previewing a menu of options. We also infused racial equity questions throughout the framework. These questions are especially critical now as communities grapple with missed learning opportunities, particularly for students of color. The updated tool helps communities be efficient, effective and strategic with data, all in the service of high-quality programs for young people, particularly those who lack access due to structural inequities. That’s what we’ve always been about—recognizing inequities in opportunities and forwarding that agenda.
What did the intermediaries find were the framework’s key benefits?
McCombs: The core benefit was that the framework focused system leaders on data use, not just data collection. It really provides a roadmap to assess and align the goals and activities of an OST system and how to measure the outputs of those activities—not just for the sake of measuring progress toward goals, but also to drive systems improvement.
Systems are constantly evolving. Very often, they get bogged down collecting data that once had a clear purpose but is now no longer utilized. In some cases, using the framework led the intermediaries to measure less but utilize more. It’s a bit like cleaning out your closet. Letting go of something you haven’t worn in a long time makes room for something else. Not using data that’s collected is a waste of resources and an opportunity cost for other activities. There’s also the burden of data collection on programs and youth. It’s very important that everything that systems ask of programs and youth has value that can be communicated back to them.
What are the toughest challenges for effective data collection and analysis
McCombs: One challenge for OST systems leaders is the development of data systems and protocols that allow for the collection and safe storage of accurate data. This is easily forgotten by people who don’t have a background in research or data science. It’s not intuitive. To help system leaders overcome this, we wrote Putting Data to Work for Young People: A Ten-Step Guide for Expanded Learning Intermediaries in 2019.
OST systems also don’t tend to be robustly funded. System leaders have to make choices on a continuous basis about where to invest monetary and human capital resources. And that leads to difficult decisions. I don’t know any OST system that’s able to do everything it wants.
In addition to using surveys and management information systems, the framework suggests low-budget options for gathering data, such as interviews with program leaders and youth representatives. Was this deliberate?
McCombs: It was an intentional choice. The goal of the framework is for systems to collect data that they can use to inform decision making. Some indicators are very expensive and time-consuming to measure well. But systems don’t have to measure everything that they do. There are other mechanisms that give people an opportunity to reflect on their work in a way that can drive future activities. System leaders can use touchpoints with community stakeholders to learn the extent to which their work is meeting the intended objectives. Some activities, like talking with youth council representatives, have benefits beyond measuring progress toward a particular goal. They build voices into the system and improve equity.
Donner: When Jennifer and the team at RAND worked with the three intermediaries, they steered them toward open-source, free and accessible data-collection tools so they wouldn’t face a funding cliff later. They were realistic with their recommendations so systems would not need a massive grant to sustain their data collection work.
McCombs: Because we’re researchers, I think people expected that we would push them to measure more and at the highest level of rigor for everything. That was not our approach. We really wanted to help them build processes that were sustainable and that they could implement themselves over time.
The sample worksheets in the guide suggest that OST intermediaries don’t need to measure everything to track progress and make informed decisions. How can they make smart choices about the data they do collect and analyze?
McCombs: It's far better to measure three things reliably and use it to drive improvement, than to measure 10 things not particularly well and not have the capacity to use any of it. As system leaders go through the framework and want to measure this and this and this, they should really think about where they can derive the greatest value and what they have the capacity to accomplish well. What pieces of data are highest leverage? How can they make the most out of every data point so that stakeholders can make decisions that advance goals and continuous improvement processes? We encourage system leaders to ask themselves: what do you have the capacity to collect, store, analyze and use right now?
How did the framework help the three intermediaries improve their data efforts? And how will it continue to be used in the field?
McCombs: Intermediaries in the study used the framework in many different ways. As small examples, Sprockets [in St. Paul] used data to more explicitly communicate with various stakeholders, including community members, funders, and policymakers. For Boston After School & Beyond, the framework propelled how it communicates data with programs in its network, and therefore, how programs utilize data themselves for their own improvement. Providence Afterschool Alliance really took stock of the data they needed, the data they didn’t, and how to share data back to providers.
Donner: Every Hour Counts is forming a learning community with a cohort of city organizations who will work intentionally with the tool over the next year to use data to drive improvement. Intermediaries come in many shapes and sizes, but there is a common through line of the importance of system indicators, program indicators and youth indicators, which all intersect with each other. The framework is designed to meet communities wherever they are in the process. We’re eager to see how it helps them move from point A to B.


