Read the Synopsis
A synopsis of the report
Investments in Building Citywide Out-of-School-Time Systems
This report examines investments six major cities made to create systems that aim to provide strong afterschool programs to more young people.
September 2009

Table of Contents
Document
- Author(s)
- Cheryl Hayes, Christianne Lind, Jean Baldwin Grossman, Nichole Stewart, Sharon Deich, Andrew Gersick, Jennifer McMaken, and Margo Campbell
- Publisher(s)
- Public/Private Ventures
Page Count
93 pages
Summary
How we did this
The study uses a case-study approach. The researchers conducted extensive phone interviews and made site visits to each of six cities between October and December 2007 to gather data on systems investments. Wherever possible, they supplemented the information gathered from a series of structured interviews with budgets and other documentation. The researchers also conducted follow-up calls to verify data, probe for hidden costs, and gather additional information as needed.
Out-of-school-time (OST) programs play a vital role in many children’s academic and social development. To address the growing demand for and interest in these programs, a number of U.S. cities have initiated efforts to create OST systems. These systems bring together program providers, schools, municipal agencies, and others with an interest in OST. The idea is to put in place a coherent, shared infrastructure to support, coordinate, and sustain OST programs citywide.
The study looks at the investments six cities made in building OST systems during the early 2000s. The cities were Boston, Charlotte, Chicago, Denver, New York City, and Seattle.
Using a case-study approach, the study explores:
- Strategies and activities commonly pursued in building citywide OST systems
- Monetary and in-kind investments associated with the efforts
- Variations in investments from city to city
- Options for financing system-building efforts.
The researchers find that cities invested in four major components of OST infrastructure:
- Providing community leadership and vision
- Improving program quality
- Expanding access to and participation in quality programs
- Financing and sustaining quality programs.
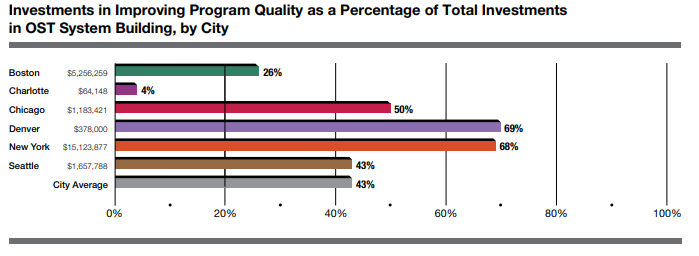
Improving program quality and expanding access accounted for the largest share of system-building investments, while financing and sustainability accounted for the smallest.
The study finds there is no single blueprint for building successful OST systems or for helping local leaders project the relevant costs of developing and maintaining them. Costs depend on factors including the desired scale of the system, strategies and activities employed, available resources, and whether the effort needs to be built from scratch.
The experiences of the six cities can provide other localities with useful ideas and information. In particular, they can increase understanding of the potential functions of OST systems, the range of resources they need, and the variety of funding sources that can be tapped to support them.

We define a 'system' as the overarching, city-level infrastructure that supports and helps sustain quality OST programming.
An online cost calculator can help users determine the costs of various OST options.
Key Takeaways
- There is no "right" cost or investment for building citywide OST systems. Costs depend on the desired scale of the system, strategies and activities employed, available resources, and whether the effort needs to be built from scratch.
- Availability of funding significantly influenced system building.
- Improving program quality and expanding access accounted for the largest share of system-building investments, while financing and sustainability received the smallest average share of investments.
- While investments in leadership are difficult to quantify, strong, committed, high-level leadership is essential to successful OST system building.
Visualizations
Materials & Downloads
What We Don't Know
Each city’s approach is unique and reflects the city’s political, historical, and economic context as well as the system-building stage it was in during the study. Given the ever changing nature of OST systems, the cities’ landscapes have continued to evolve since the researchers were on site.
This study raises a number of questions for future research. Some of those are:
- Are there patterns of system building (e.g., sequences of planning, development, and implementation)? What factors drive these patterns and associated timelines? To what extent are these patterns politically driven versus driven by available funding?
- What are the required resources (monetary and nonmonetary) for developing and maintaining particular system components and capacities? Can ongoing operating costs be projected? What are the critical variables that will affect these costs? Are they controllable?
- Are there cost differences depending on the type of provider (e.g., city agency, intermediary, private entity, or contractor)?
- What types of sustainability planning yield OST systems that last long after seed funding ends and continue to improve the quality and expand the reach of OST programs to address the needs of local children, youth, and families? In what ways and how often should these plans be revisited?
- What are the outcomes or impacts of various system-building investments? What accounts for differences in results across cities?
Topics:
Now Viewing:
Overview
Next: Research Approach

